

1. Charge Breakdown
| Charge Item | Basis / Calculation | Amount (Rs.) |
|---|---|---|
| Industrial Energy Charges | Net Consumption × Rate — Gross 168,876 kWh − Solar Adjustment 146,224 kWh = Net Billed 22,652 units × Rs. 7.50 | 1,69,890.00 |
| Peak Hour Surcharge | 22,652 units × Rs. 1.875 | 42,472.50 |
| Demand Charges | Billing Demand × Rate — Recorded 784.80 kVA vs. 90% of Permitted MD 855.00 kVA (950×0.90) → higher of the two (855 kVA) × Rs. 608.00 | 5,19,840.00 |
| Meter Rent | Fixed monthly utility fee | 4,090.00 |
| Electricity Tax | 5% on taxable amount | 34,476.00 |
| Testing Fees | Fixed statutory fee | 4,270.00 |
| Assessment Amount | Subtotal of all tax-affecting charges above | 7,75,039.00 |
2. Open Access Adjustments
| Component | Amount (Rs.) |
|---|---|
| Wheeling Charges | 77,570.00 |
| Transmission Charges | 96,848.00 |
| DSM (Deviation) Charges | 36,018.00 |
| RKvah (Reactive Power) Penalty | 8,731.00 |
| System Operation & Scheduling Charges | 8,159.00 |
| AMR Meter Reading Charges | 445.00 |
| Total — Open Access Adjustments | 2,27,771.00 |
3. Self-Generation & Net Payable
| Item | Basis | Amount (Rs.) |
|---|---|---|
| Self Generation Tax | Tax on captive solar consumption | 14,622.00 |
| Net Amount Payable | Assessment (7,75,039) + Adjustments (2,27,771) + Self-Gen Tax (14,622) | 10,17,432.00 |
4. Plant Energy Profiling
Time-of-day (TOD) register readings for the billing period. Multiplier (MF) = 1,200 for all slots.
| Slot | Description | Total Billed | Recorded Peak Demand |
|---|---|---|---|
| C24 | Gross (Total Recorded) | 168,876 kWh | 784.80 KVA |
| C1 | Peak Hours (06:00–09:00 & 18:00–21:00) | 30,648 kWh | 740.40 KVA |
| C2 | Normal Hours | 19,344 kWh | 757.20 KVA |
| C3 | Night Hours (22:00–05:00) | 0 kWh | 0.00 KVA |
| C5 | Solar Hours (peak solar window) | 27,816 kWh | 410.40 KVA |
| kVAhr | Apparent Energy (total power drawn) | 185,520 kVAhr | N/A |
| rkVAhr | Reactive Energy (inductive lag) | 30,708 rkVAhr | N/A |
5. Key Insights
Solar netting drives the real energy charge
Billing starts from a gross total of 168,876 kWh. 146,224 kWh of that is deducted via solar/open-access adjustment, leaving a net billed consumption of only 22,652 kWh — the figure the energy rate and peak-hour surcharge are actually calculated on. The Rs. 10.17 lakh final payable layers demand charges, open-access adjustments, and taxes on top of that smaller net figure.
Demand charges are the single largest line item
At Rs. 5,19,840, demand charges alone are 67% of the Assessment Amount (51% of the final Net Payable) — more than three times the energy charge itself. Billing lands at the 90%-of-contract-demand floor (855 KVA) even though actual recorded demand (784.80 KVA) was lower, meaning Unimech is paying for reserved capacity it didn't draw down to. This is the highest-leverage line item: either lowering real peak draw or renegotiating the permitted MD (950 KVA) downward has a large, direct effect on the bill.
Billing runs on kWh, not kVARh — but power factor still costs you
The core Industrial Energy Charge is billed purely on kWh (active energy) — reactive power inefficiency doesn't inflate that main rate directly. But it isn't free either: recorded power factor is 0.91 (kWh ÷ kVAh = 168,876 ÷ 185,520), just above TNPDCL's 0.90 threshold, and the RKvah (reactive-power) penalty of Rs. 8,731 is already being charged this period as a separate line. Power-factor correction saves specifically on that penalty line — and, more importantly, protects against materially steeper penalties if PF drifts below 0.90.
Non-energy adjustments are a meaningful cost
Rs. 2,27,771 in open-access wheeling, transmission, DSM deviation, reactive-power penalty, scheduling, and AMR charges sit outside the core energy/demand calculation but still add roughly 29% on top of the Assessment Amount.
Time-of-day slotting penalizes shiftable load
Peak Hour consumption (06:00–09:00 & 18:00–21:00) carries a Rs. 1.875/unit surcharge. Any melting or heating load that can be shifted out of that window into Night or Solar hours is charged at a lower or zero surcharge for the same units consumed — one of the more direct, actionable levers once load-by-time visibility exists (see the SLD's Meter 1 pre-alarm and TOD tracking).
The underlying driver: furnace load signature
The plant's 350kW Inductotherm induction melting power supply creates the electrical behaviour behind several of the adjustment items above:
- Reactive-power (RKvah) penalty — from sub-optimal power factor under furnace loading (PF 0.91)
- DSM deviation charges — from unscheduled demand swings during melt cycles
- Peak-hour surcharge exposure — from shiftable load running inside the peak window
None of these are visible today without load-by-time visibility into what's actually driving demand — which is exactly why Meter 2 (the furnace feeder) is the priority metering point in Phase 1, and why this exercise exists in the first place.
Transformer signature: capacity isn't the constraint, the tariff is
The 1,250 kVA transformer nameplate (Dyn11, 22kV/433V, secondary FLC 1,666.76A) shows real headroom against actual load: recorded peak demand (784.80 KVA) and even the billed floor (855 KVA) both sit well under the transformer's own rated capacity. The plant physically has room to run harder without new transformer capacity — the cost pressure comes entirely from the 950 KVA contract/tariff structure (and the 90%-of-contract billing floor), not from any physical capacity limit. Max total losses at 100% rated load are 9,660W (oil rise 40°C / winding rise 45°C) — worth keeping in view if load grows toward the transformer's actual ceiling. See the nameplate photo under References below.
6. How kVA Maximum Demand Is Actually Computed
Directly relevant to the Rs. 5,19,840 demand charge above, and to the SLD's Meter 1 pre-alarm — this is the mechanism the pre-alarm has to replicate to be trustworthy.
Demand Integration Period (DIP) and the block-vs-sliding distinction
IS 14697 (the Indian Standard for CT/PT-operated static energy meters) specifies a Demand Integration Period of 15 or 30 minutes for kVA maximum-demand metering. Within that DIP, a meter can compute demand one of two ways:
- Block (fixed) window — the DIP is clock-anchored: 10:00–10:30, 10:30–11:00, and so on. A new window only starts when the previous one ends.
- Sliding window — the DIP recomputes on a shorter sub-interval (commonly 10 minutes for a 30-min DIP, per the CBIP guide on static energy meters), so the window "slides": 10:00–10:30, then 10:10–10:40, then 10:20–10:50, and so on. This is what current-generation DISCOM AMI meters use.
Why the distinction isn't academic — a worked example
Take a constant 1,000 kVA load running for exactly 30 minutes, from 10:15 to 10:45 — straddling the boundary between two fixed blocks:
| Method | What it captures | Recorded MD |
|---|---|---|
| Block window | Each fixed block (10:00–10:30 and 10:30–11:00) only overlaps 15 min of the load each — averages out low | 500 kVA |
| Sliding window | One 10-min-step window (10:20–10:50) fully overlaps the load period | 833 kVA |
Same load, 67% different reading depending on method. A meter using block windows can systematically under-report true peak demand relative to what a sliding-window DISCOM meter actually bills — the exact failure mode that would make a site-side pre-alarm misleading: it reads comfortably under 950 kVA while the utility's own meter is already over.
What this means for Meter 1
Both Meter 1 candidates on the SLD (Elmeasure LG 6400 and Selec MFM384-C) support configurable sliding demand — a DIP/duration parameter plus a separate sub-interval parameter (Elmeasure: DIP + sliding width; Selec MFM384-C: Modbus registers 40035 "Demand Interval Duration" + 40036 "Demand Interval Length"). Neither meter fires a native threshold alarm on its own — the IoT Gateway / EMS platform reads the demand register over Modbus and raises the pre-alarm in software, the same way regardless of which meter is installed.
Open item: TNPDCL's exact DIP and sub-interval for this connection aren't confirmed yet — the bill only reports the resulting recorded demand (784.80 kVA), not the computation parameters behind it. Whichever Meter 1 candidate is ordered needs to be commissioned with a DIP/sub-interval that matches or is finer than TNPDCL's, so it never reads more leniently than the utility's own meter would.
References & Attachments
Source documents and equipment nameplates the figures above and in the SLD are drawn from.
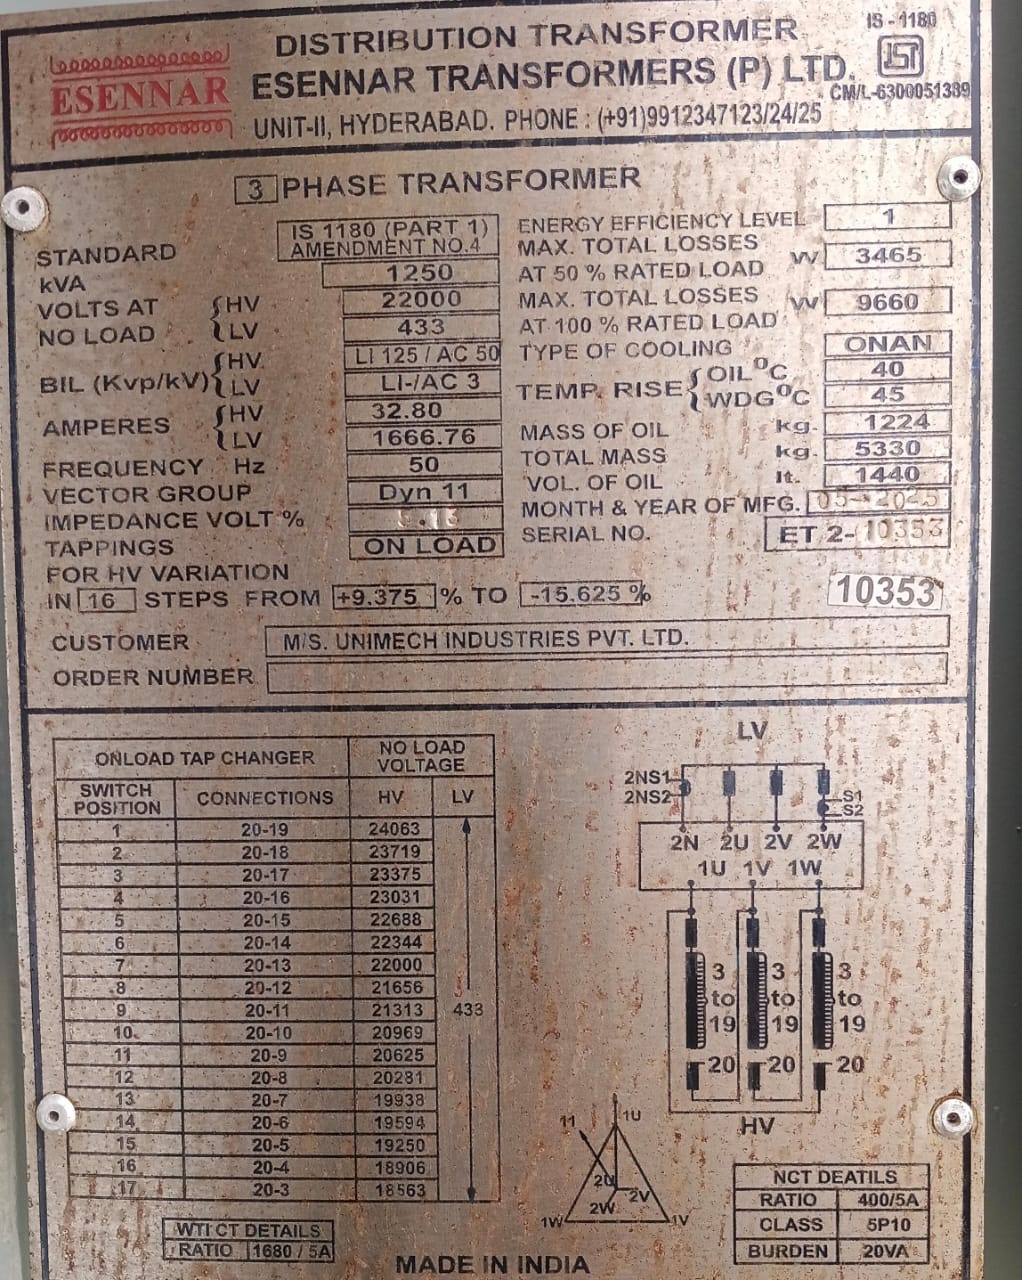
Transformer Nameplate
Esennar Transformers, 1,250 kVA, 22000V/433V, Dyn11, LV current 1,666.76A — confirms the SLD's transformer FLC figure directly against the physical nameplate.
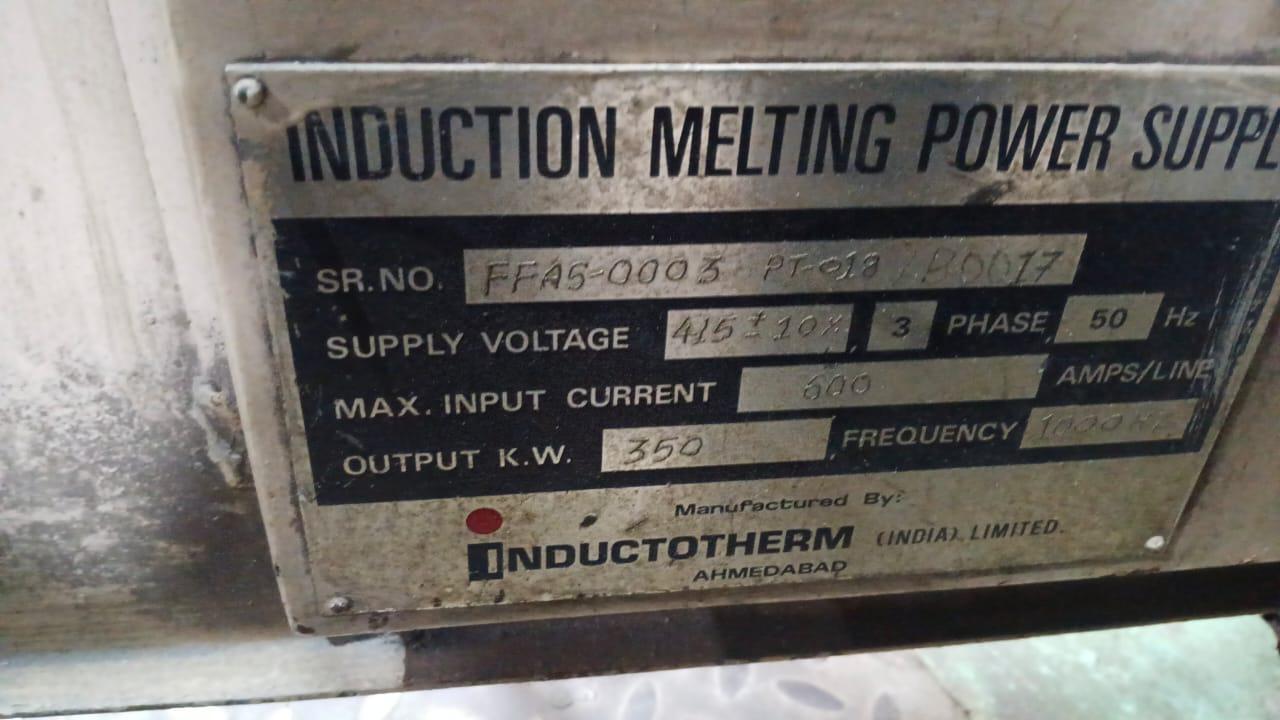
Furnace Nameplate
Inductotherm (India) Ltd. induction melting power supply — 415V±10% 3-phase, max input 600A/line, output 350kW. Confirms the SLD's Meter 2 sizing directly against the physical nameplate.